

When Words Aren't Enough: Visual Research for a Global Brand
Client: A global personal care company
Sector: Consumer product R&D
Methods: Participatory visual insights, live illustration, visual synthesis
Deliverable: Visual insight cards / customer journey storyboard
The Brief
A global personal care company was exploring whether to bring a professional tool — one used exclusively in clinical settings — into the consumer market. To inform that decision, they needed to understand the experience from the people who knew it best: health professionals.
Initial research efforts weren't producing what the R&D team needed. Survey-based methods captured what practitioners said — but not how they thought, sequenced, or made decisions in practice. The team was left with answers, but not understanding.
Our Approach
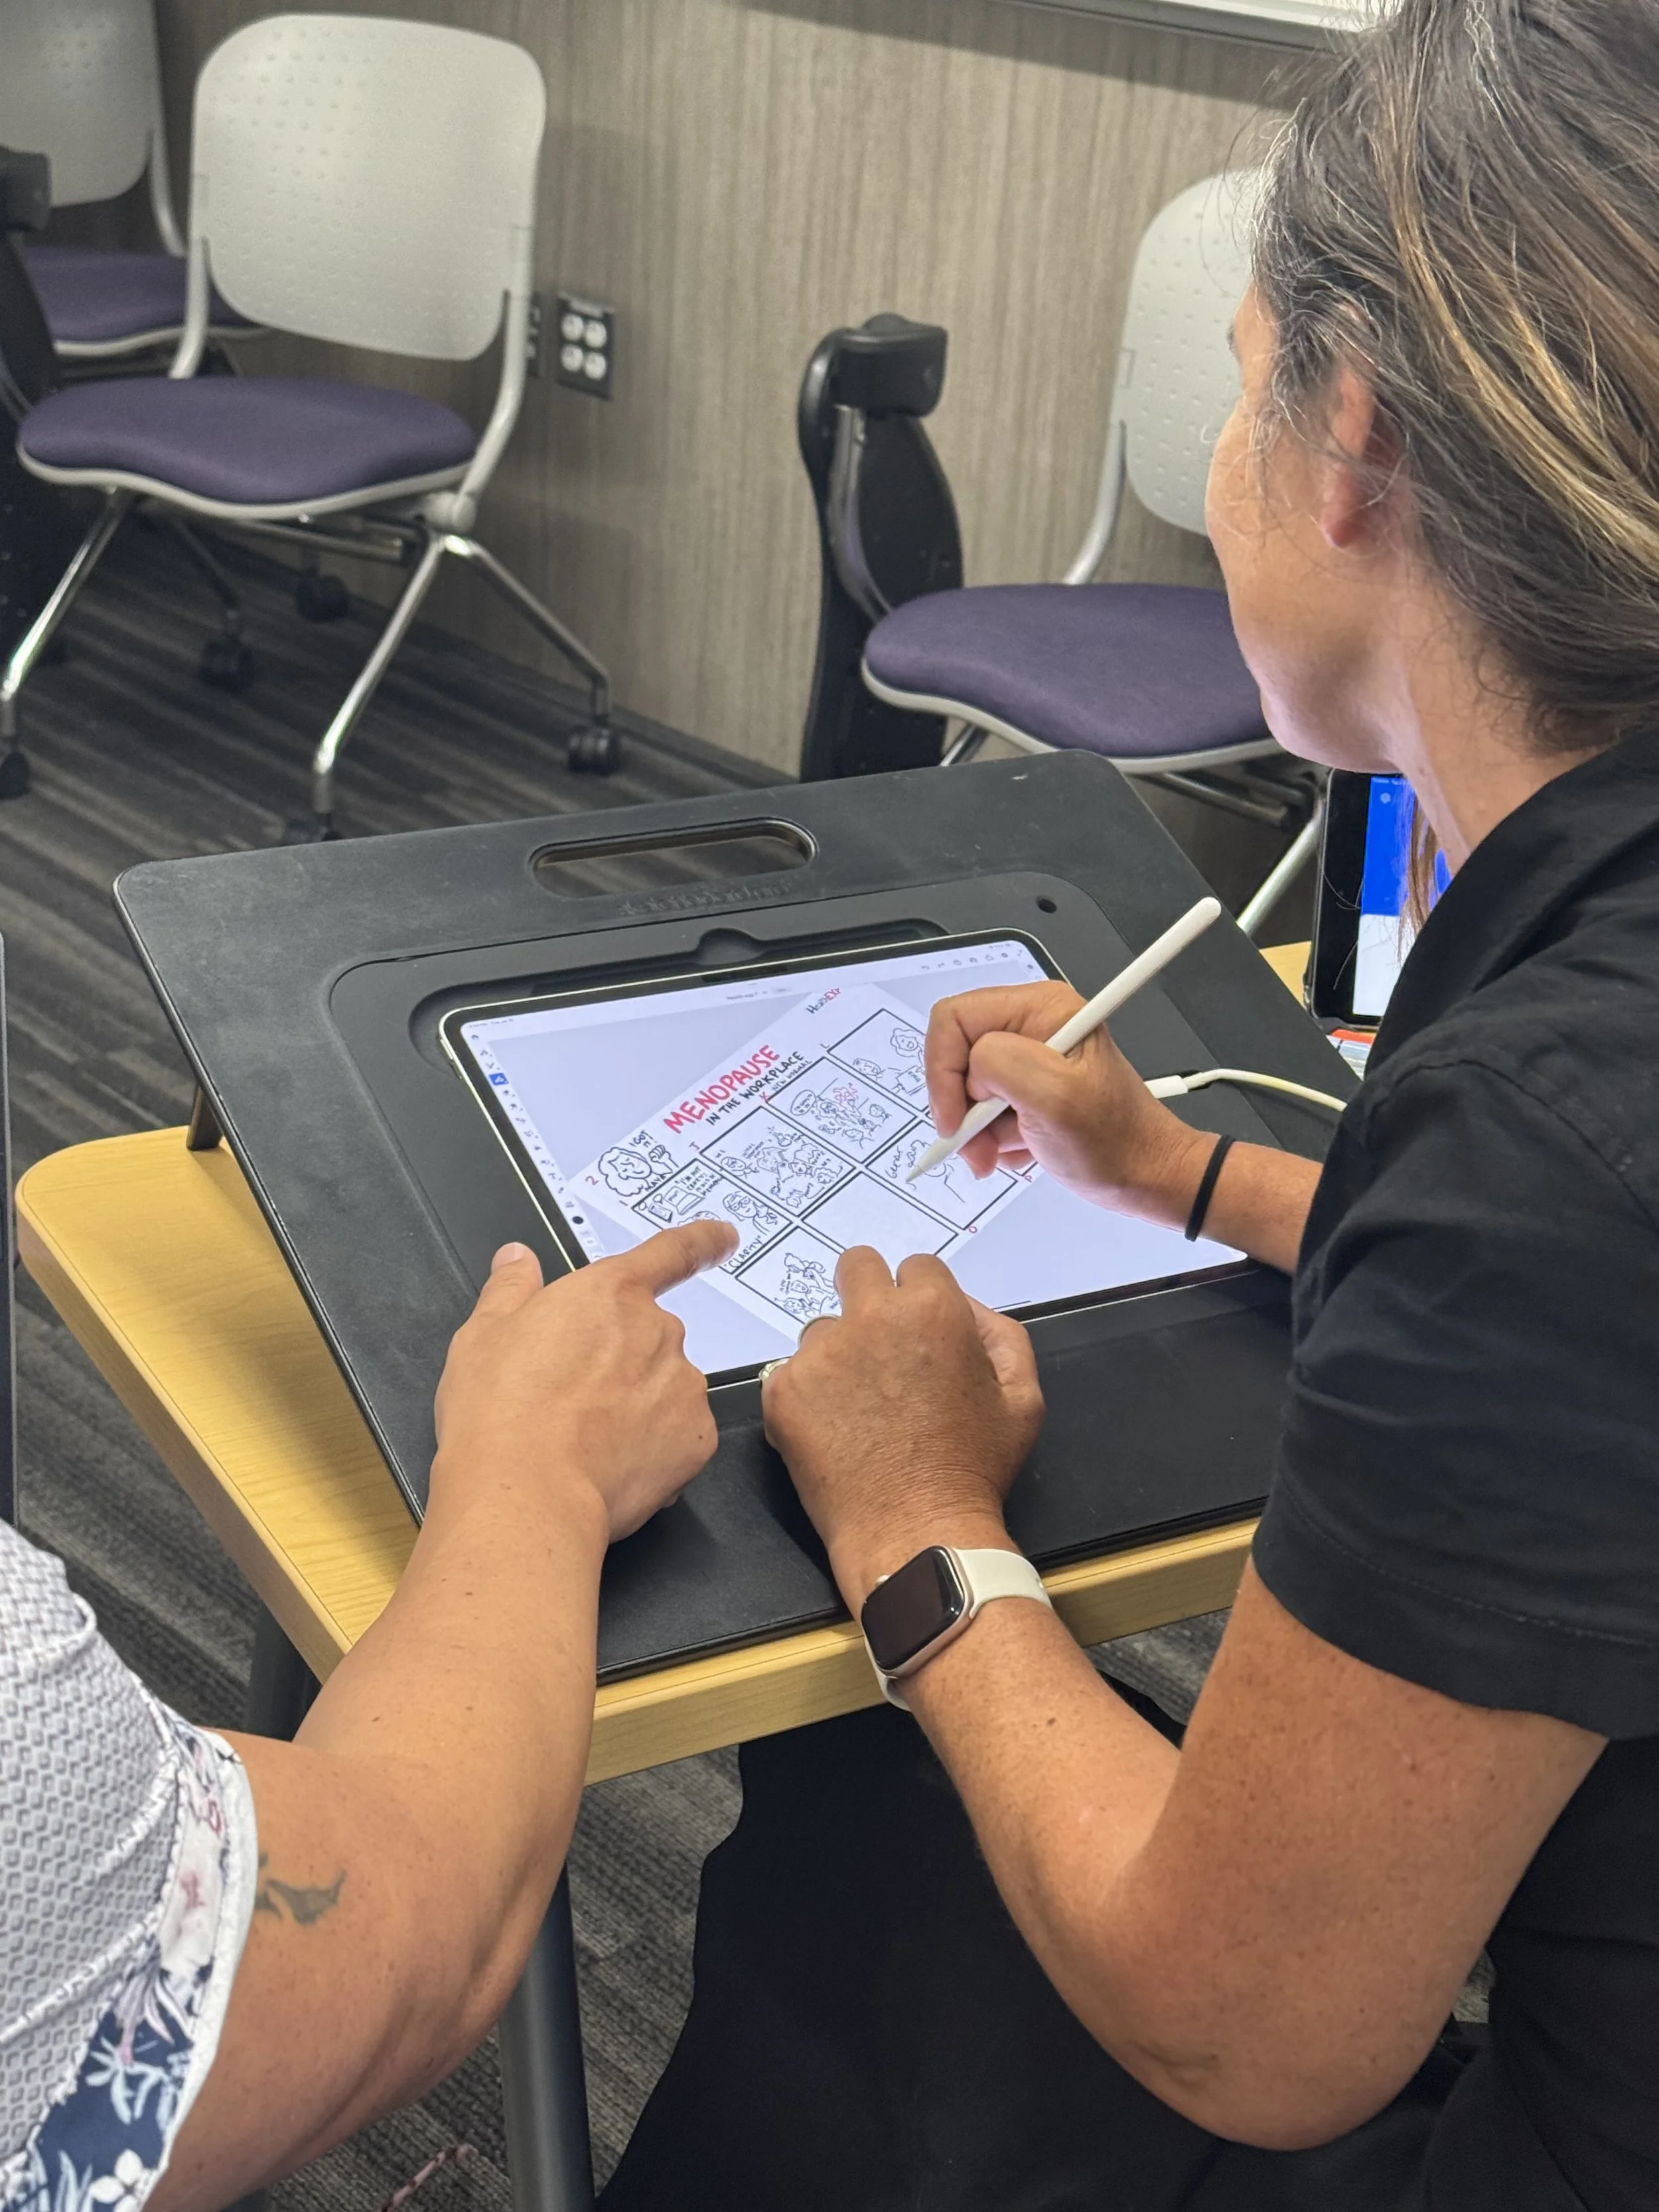
We proposed a participatory visual insights session — a method where we draw in real time as participants describe their experience, on a shared screen they can see and respond to.
Rather than asking health professionals to fill out a questionnaire, we invited them into a conversation. As they described the process of delivering a specialized treatment — the setup, the patient interaction, the judgment calls, the feel of the work — we drew what we were hearing. Scenes, sequences, small details that surfaced as significant.
The drawing was a thinking tool. When practitioners saw their experience rendered visually, they corrected it, expanded it, and revealed things they hadn't thought to say. The image gave them something to push back against.
The Process
Step 1 — Live sessions with health professionals
Participatory drawing sessions, conducted on a shared screen. I illustrated in real time as participants described their workflow. They annotated, corrected, and built on what they saw.
Step 2 — Synthesis with the R&D team
All raw drawings were placed into a FigJam board. Working alongside the R&D team, we moved through the material together — finding patterns, naming themes, and identifying the through-line in what the practitioners had shared.
Step 3 — Visual cards and storyboard
The insights were distilled into a set of visual cards: a customer journey storyboard that mapped the professional experience end to end. The cards were designed to work in multiple contexts — as a reference for the development team, and as a pitch tool for internal stakeholders deciding whether to move the product forward.
The Output
A visual storyboard capturing the complete practitioner experience, structured as a customer journey. Designed to:
Communicate findings quickly to non-research audiences
Surface not just what practitioners do, but why, and in what sequence
Identify adjacent opportunities that a product brief might otherwise miss
Why it Worked
Most research methods ask people to describe experience in language — and language compresses, edits, and abstracts. Visual methods invite a different kind of recall. When you can see something taking shape in front of you, you remember more, and you correct more precisely.
The deliverable wasn't just research output. It was a shared object that the team could use to think together — across disciplines and across conversations.
Want to use visual facilitation for your research or discovery process?